页面性能指标
思考 🤔
如何精准定位页面那一块渲染问题?
指标
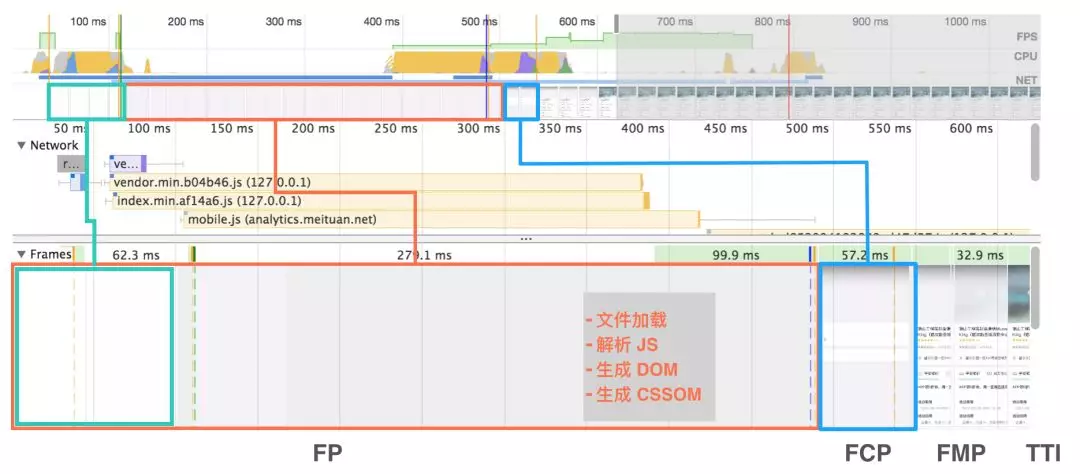
为页面渲染各个阶段的标识符,可以通过计算得到
| 阶段(简写) | 描述 | 阶段(全称) |
|---|---|---|
| TTFP | 首字节时间 | Time TO Frist Byte |
| FP | 首次绘制(第一个节点) | First Paint |
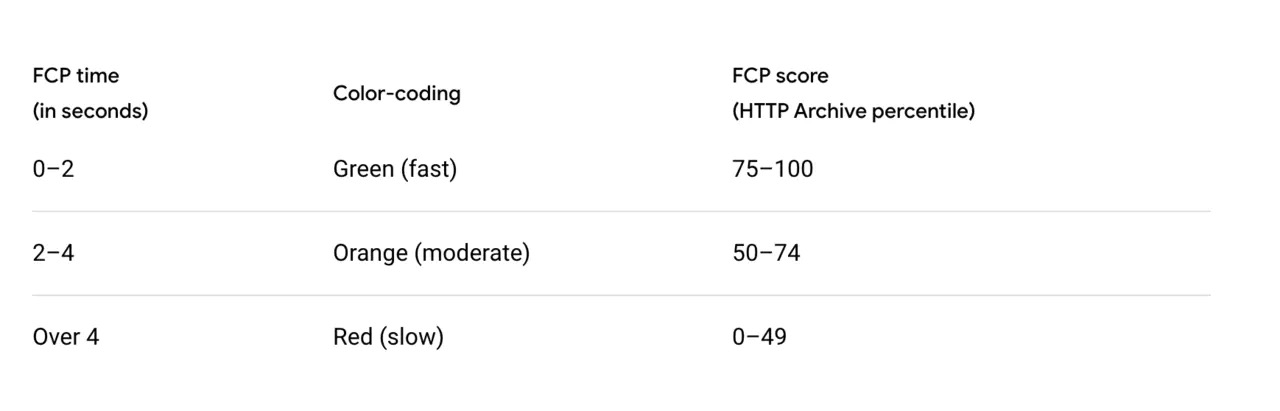
| FCP | 首次有内容的绘制(骨架) | First Contentful Paint |
| FMP | 首次有意义的绘制(包含所有元素/数据) | First Meaningful |
| TTI | 达到可交互时间,推荐的响应时间是100ms以内否则有延迟 | Time To Interactive |
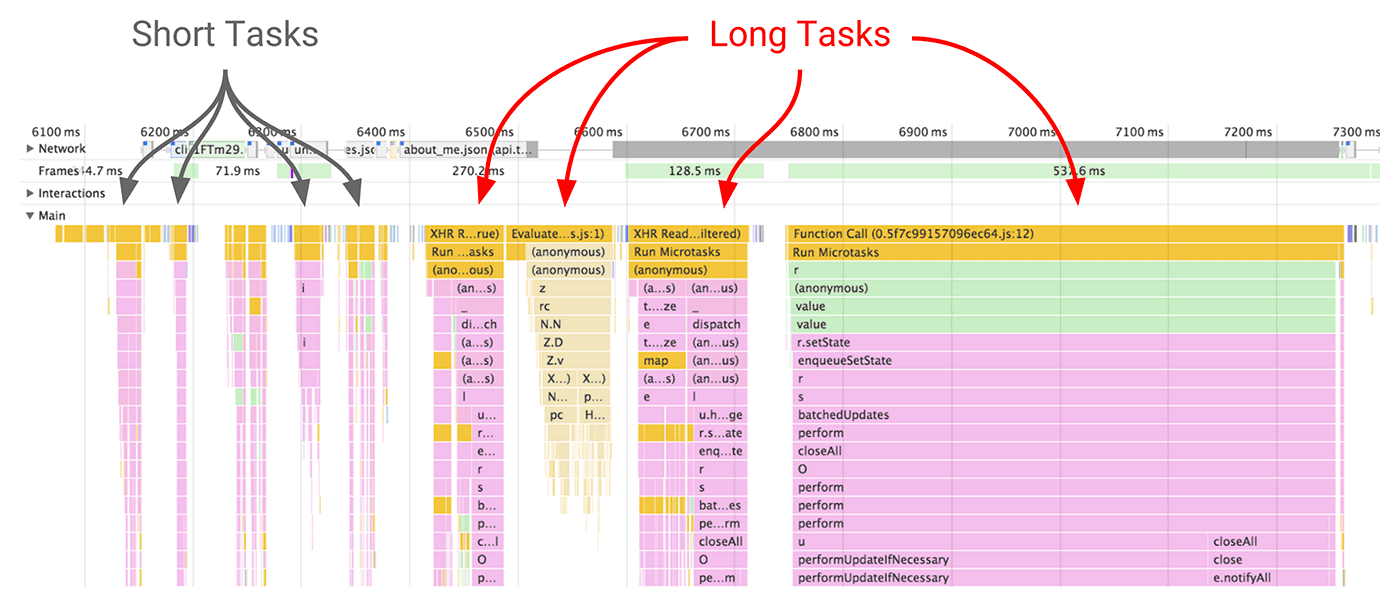
| Long tasks | 超过了 50ms 的任务 | |
| SSR&&CSR | 服务端渲染和客户端渲染 | Server-Side-Rendering / Client Side Rendering |
| Isomorphic | 同构化 |
FP、FCP、FMP、TTI
LongTask
新增指标
LCP、FID、TBT、CLS
| 阶段(简写) | 描述 | 阶段(全称) |
|---|---|---|
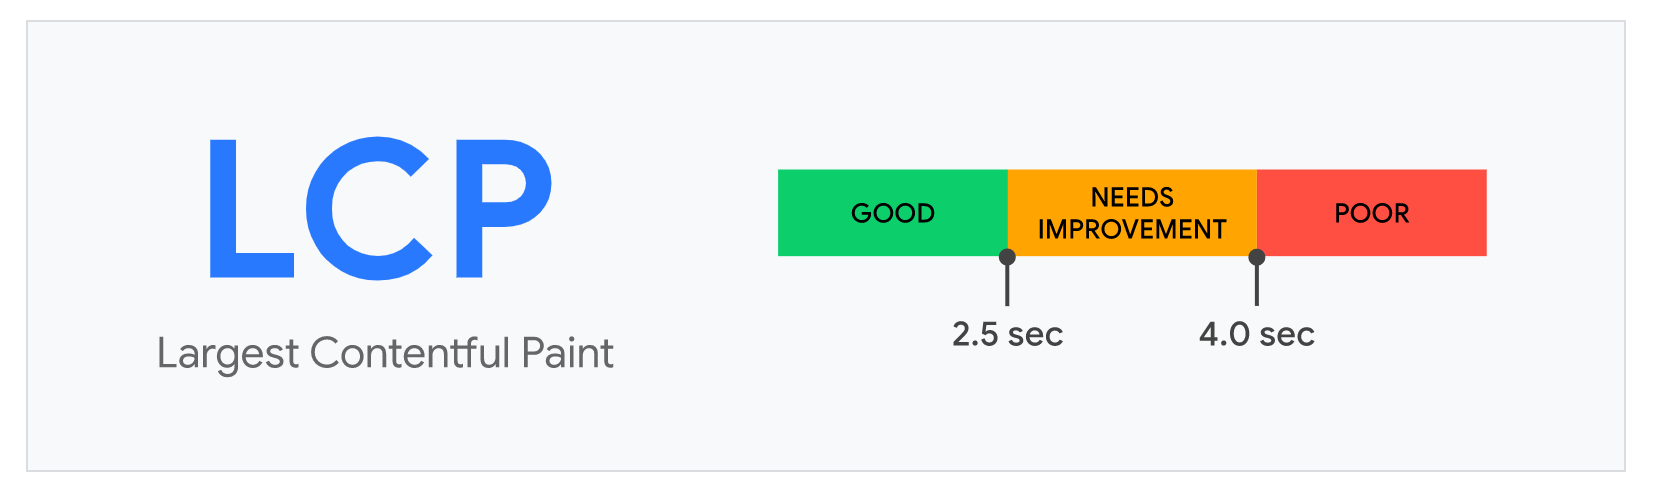
| LCP | 最⼤内容绘制,⽤于记录视窗内最⼤的元素绘制的时间,该时间会随着⻚⾯渲染变化⽽变化,因为⻚⾯中的最⼤元素渲染过程中可能会发⽣改变,另外该指标会在⽤户第⼀次交互后停⽌记录 | LCP(Largest Contentful Paint) |
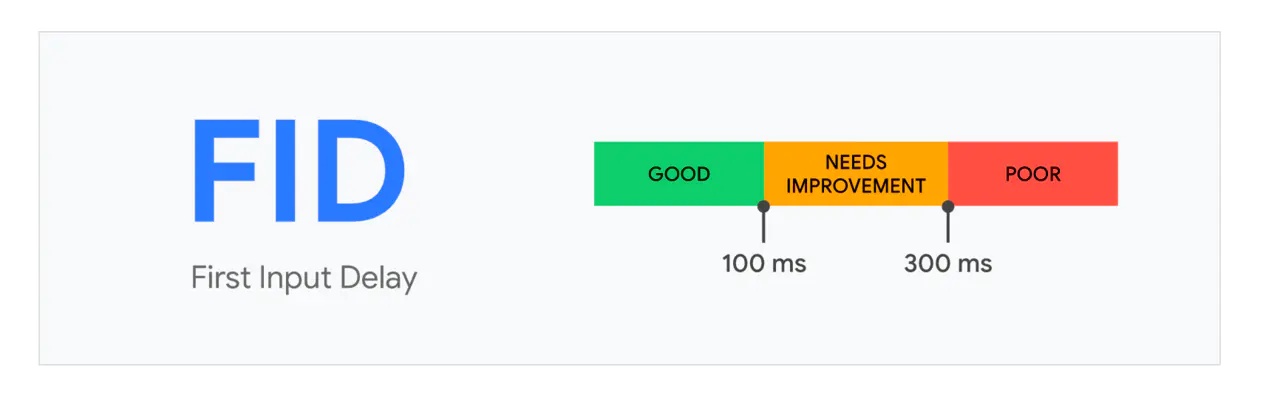
| FID | ⾸次输⼊延迟,记录在 FCP 和 TTI 之间⽤户⾸次与⻚⾯交互时响应的延迟 | FID(First Input Delay) |
| TBT | 阻塞总时间,记录在 FCP 到 TTI 之间所有⻓任务的阻塞时间总和 | TBT(Total Blocking Time) |
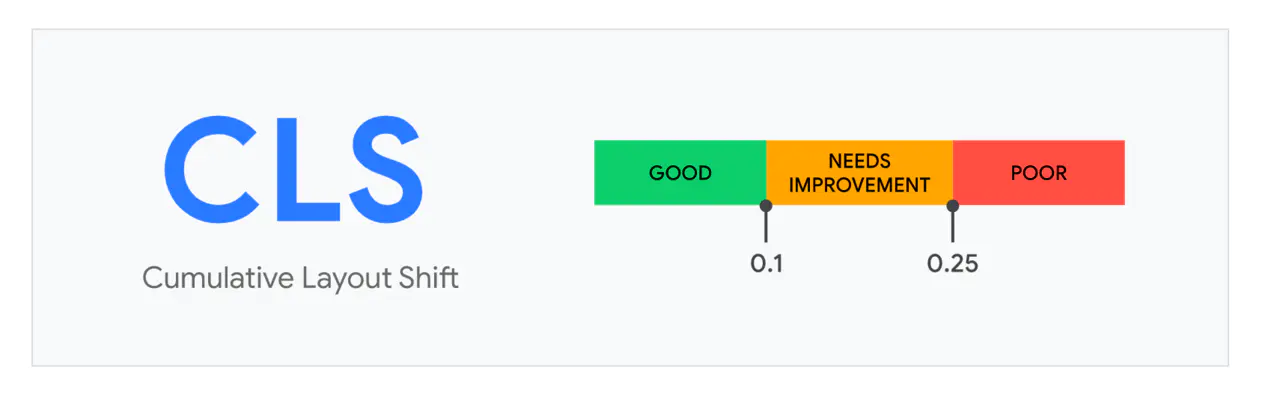
| CLS | 累计位移偏移,记录了⻚⾯上⾮预期的位移波动。使⽤按钮动态添加了某个元素,导致⻚⾯上其他位置的代码发⽣了偏移,造成了⻚⾯ | CLS(Cumulative Layout Shift) |
简单的指标标准
总结
LCP: 代表了⻚⾯的速度指标, LCP 能体现的东⻄更多⼀些。⼀是指标 实时更新,数据更精确,⼆是代表着⻚⾯最⼤元素的渲染时间,最⼤元 素的快速载⼊能让⽤户感觉性能还挺好。
FID: 代表⻚⾯的交互体验指标,交互响应的快会让⽤户觉得⽹⻚流畅。
CLS: 代表了⻚⾯的稳定指标,尤其在⼿机上这个指标更为重要。因为⼿ 机屏幕挺⼩,CLS 值⼀⼤的话会让⽤户觉得⻚⾯体验做的很差。
如何获取指标
通过浏览器自带 Api 性能监测对象 MDN PerformanceObserver 访问。
PerformanceObserver
性能监测对象
测试代码 🍺
<!DOCTYPE html>
<html lang="en">
  <head>
    <meta charset="UTF-8" />
    <meta name="viewport" content="width=device-width, initial-scale=1.0" />
    <title>Document</title>
    <link rel="stylesheet" href="https://cdn.staticfile.org/twitter-bootstrap/5.0.0-alpha1/css/bootstrap-reboot.min.css"/>
  </head>
  <body>
    <div id="app">
      <h1>target dom</h1>
      <script>
        performance.mark('target');
      </script>
    </div>
    <script>
      const observer = new PerformanceObserver((list) => {
        for (const entry of list.getEntries()) {
          console.log(entry.name);
          console.log(entry.startTime);
          console.log(entry.duration);
          console.log(entry.entryType);
        }
      });
      observer.observe({ entryTypes: ['paint', 'mark', 'longtask'] });
    </script>
  </body>
</html>
entryType
更为详细的描述请参考 entryType
| 属性 | 描述 |
|---|---|
| frame, navigation | 文件的地址。 |
| resource | 所请求资源的解析URL。即使重定向请求,此值也不会更改。 |
| mark | 通过调用创建标记时使用的名称 performance.mark()。 |
| measure | 通过调用创建度量时使用的名称 performance.measure()。 |
| paint | 可能是 first-paint 或 first-contentful-paint。 |
| longtask | 在浏览器执行超过 50ms 的任务 |
获取更多指标信息
可以通过 PerformanceTiming 可以获取浏览器的指标信息,关于 dns 解析时间,tcp 耗时,request请求耗时,解析dom树耗时,白屏时间,domready时间,onload时间,js内存使用占比等。
测试案例 🍺
let t = performance.timing;
console.log(
  'DNS查询耗时 :' + (t.domainLookupEnd - t.domainLookupStart).toFixed(0)
);
console.log('TCP链接耗时 :' + (t.connectEnd - t.connectStart).toFixed(0));
console.log(
  'request请求耗时 :' + (t.responseEnd - t.responseStart).toFixed(0)
);
console.log(
  '解析dom树耗时 :' + (t.domComplete - t.domInteractive).toFixed(0)
);
console.log('白屏时间 :' + (t.responseStart - t.navigationStart).toFixed(0));
console.log(
  'domready时间 :' +
    (t.domContentLoadedEventEnd - t.navigationStart).toFixed(0)
);
console.log(
  'onload时间 :' + (t.loadEventEnd - t.navigationStart).toFixed(0)
);

if ((t = performance.memory)) {
  console.log(
    'js内存使用占比 :' +
      ((t.usedJSHeapSize / t.totalJSHeapSize) * 100).toFixed(2) +
      '%'
  );
}
Google 官方提供的优化学习方案
google 官方提供 web.dev
通过第三方库获取
NPM: web-vitals;
可以获取的指标有:CLS、FID、LCP、以及 FCP、TTFB
import {getCLS, getFID, getLCP} from 'web-vitals';

getCLS(console.log);
getFID(console.log);
getLCP(console.log);
思考
思考 🤔
如何做一个小型的监控系统?
- 通过上述的方法拿到自己想要的指标
- 去服务器上请求 一个 1KB 大小的图片 并带上这些指标参数
- 使用 navigator.sendBeacon() 发送, 参考 sendBeacon
- Node 读取服务器日志 过滤有效的接口
- 对接口参数整理并进行分析
- 开启定时任务每天凌晨12.00 开始读取数据并绘制出图表
为什么使用 navigator.sendBeacon() 进行发送?
navigator.sendBeacon() 方法可用于通过 HTTP 将少量数据异步传输到 Web 服务器 而不占用进程
发送可以使用的优先级:
navigator.sendBeacon() > ajax > fetch